MyTimes | News Reader App using NewsApi.org | REST library
kandi X-RAY | MyTimes Summary
kandi X-RAY | MyTimes Summary
Note: Please use your own API KEY. Its very easy to set up. Just go to If you do not have a gradle.properties file, create one. Build the project and Run.
 Support
 Quality
 Security
 License
 Reuse
Reuse
Top functions reviewed by kandi - BETA
- Initialize the search
- Helper method to search all items
- Initialize views
- Creates the toolbar
- Called when the activity is created
- Button link to full article
- Sets the floating action button
- Receive data from the data adapter
- Creates the activity view
- Creates the overview
- Create library card views
- Creates the overview text view
- Initializes the drawer
- Creates recyclerView
- Loads news JSON data
- Creates the drawer
- Creates the web view
- Initialize web view
- Region SaveInstanceState
- Called when the menu item is selected
- Called when a menu item is selected
- OnBindViewHolder method sets the title and the title of the card
- Called when a back button is pressed
- Restore the toolbar
MyTimes Key Features
MyTimes Examples and Code Snippets
Community Discussions
Trending Discussions on MyTimes
QUESTION
I have the following functional component and de-structuring the parameter props:
...ANSWER
Answered 2021-Apr-27 at 07:01You can just do
QUESTION
I am transitioning from using a heatmap created using the lattice "levelplot" to one using ggplot2, but I'm running into an issue in how the two packages deal with uneven x-axis variables.
Here is my data with an uneven time series:
...ANSWER
Answered 2020-Dec-11 at 20:05One way to do this would be to calculate the tiles you want to plot as rectangles and draw them with geom_rect. You could even set a threshold to allow you to define a different but consistent maximum gap between consecutive measurements:
QUESTION
I am creating a simple polling website using HTML & JavaScript (through Glitch) and also Firebase, I followed a tutorial to do it. I have it all working and the voting works fine and displays the results as intended. I now want to take the results and use them to display a chart on my HTML page. I understand how this works, just not how to get the voting results variable into the JS code for the chart. I am using charts.js and the code for this is towards the bottom. The y values should be a variable reading the total votes, but it isn't working. Any suggestions?
Thanks
...ANSWER
Answered 2020-Oct-13 at 12:19Try placing the chart.js code only when firebase has loaded and performed its needed actions.
Try this:
QUESTION
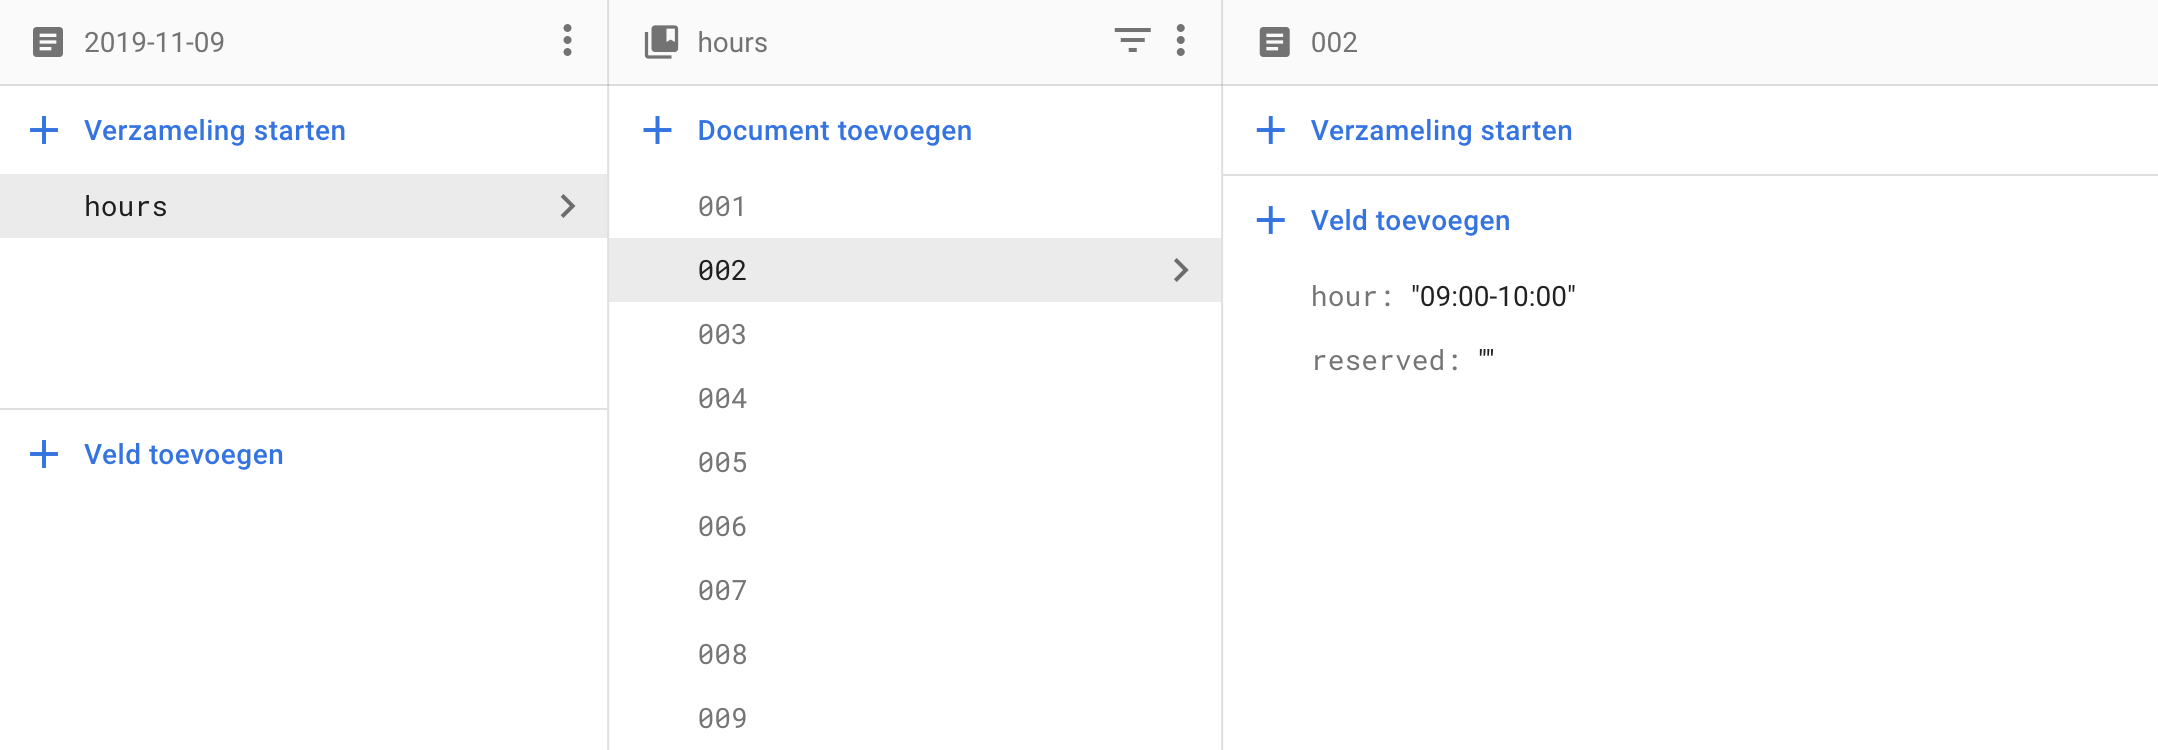
For an app I'm building in Flutter I'm trying to retrieve a list of reserved timeslots by the logged in user across different days from Firestore. I get to a point where I can retrieve the reserved timeslots on a given day (by hardcoding the day and passing it on to a futurebuilder), but when I try to retrieve data from a collectionGroup the listview stays empty (snapshot doesn't have data). Now, as a Flutter beginner I find understanding how to handle collectionGroup queries quite difficult and therefore any help would be appreciated!
For a quick overview of how my database is structured I have included 2 pictures on github:
Below I have included my futurebuilder and listview builder
...ANSWER
Answered 2019-Nov-18 at 13:11In your example, you are not using a collectionGroup query. You need to do something like Firestore.instance.collectionGroup('hours').where('reserved', isEqualTo: '').getDocuments(); for non-reserved slots.
So, what do you store in your 002 document when that slot ís reserved? And why don't you use an explicit type like a boolean for the status? That makes it easier too.
QUESTION
I have an Object MyTimes and in that object there are fields name ,start_date and configuration.
I have an array of this object, MyTimes [] mytimes
I am trying to sort the array by the start time but am struggling how to go about it.
The start_time field is a string, so this needs converting to a datetime.
ANSWER
Answered 2019-Mar-08 at 14:12You have two main approaches:
- Make your class implement Comparable
- Use a custom Comparator
Then, you can choose the field to compare from, and transform it.
IE (implementing comparable):
QUESTION
I have 1 time unit of signal history. My dominant frequency is 1/100 time units. When I use numpy's fft function, I am limited in resolution by the extent of the signal history. How can I increase the resolution of my frequency comb without corrupting my signal?
...ANSWER
Answered 2018-Sep-30 at 18:47Your goal, recovering spectral information from a "too short" , i.e. << sample_rate / frequency_of_interest, window seems ambitious.
Even in the most simple case (clean sine wave, your example) the data look pretty much like a straight line (left panel below). Only after detrending we can see a tiny bit of curvature (right panel below, note the very small y-values) and that is all any hypothetical algorithm can go by. In particular, FT---as far as I can see---will not work.
If we are very lucky there is one way out: comparing derivatives.
If you have a sinosoidal signal with an offset---like f = c + sin(om * t´---then the 1st and 3rd derivatives will be om * cos(om * t) and -om^3 * cos(om * t)´´.
If the signal is simple and clean enough this together with robust numerical differentiation can be used to recover the frequency omega.
In the demo code below I use a SavGol filter to obtain the derivatives while getting rid of some high frequency noise (blue curve below) that had been added to the signal (orange curve). Other (better) methods of numerical differentiation may exist.
Sample run:
QUESTION
I have an error in NEWS_API_KEY when I edited it return back in this class
...ANSWER
Answered 2018-Jul-19 at 11:40Use double quote (") while initialize String variable,
QUESTION
I have several time vectors with different sizes and one time vector with secondly sampled.
I was trying to find the closest point to the element $i^{th}$ but this method is insanely slow.
...ANSWER
Answered 2018-Jul-02 at 07:20The posted question contains two questions, actually. The first one asks for a faster method to find the closest value in rTime for each value given in SampleTime.
The for loop of the OP "prints" the indices of the nearest value in rTime. (Well, actually the code snippet of the OP returns nothing without a print() statement or storing the values.)
The code below returns the indices using a rolling join to nearest which is available with the data.table package.
QUESTION
I have an activity with a listview that contains couple of EditText and image view. When User is sign up his data (name,phone,profile image etc...) stored in firebase. I want the imageview which located in listview row to show the profile image of each user. I have the image download Uri and I use picaso to set the profile image to the image view.
The problem is: the profile image shown only in the last row of the listview..
This is how I set the profile image to the ImageView:
...ANSWER
Answered 2017-Aug-26 at 23:23"profileImage" is a class variable and you get image uri through async request, so when the image uri is loaded you have the last reference to ImageView. You could try...
QUESTION
I have a series of dates (they are class Dates) that represent dates someone did something:
...ANSWER
Answered 2018-Mar-31 at 18:21With dplyr you can do it like below, based on your example data.
But you need to be aware that depending on how your data.frame looks like, you will need to add a group_by of userid's or more variables.
Community Discussions, Code Snippets contain sources that include Stack Exchange Network
Vulnerabilities
No vulnerabilities reported
Install MyTimes
You can use MyTimes like any standard Java library. Please include the the jar files in your classpath. You can also use any IDE and you can run and debug the MyTimes component as you would do with any other Java program. Best practice is to use a build tool that supports dependency management such as Maven or Gradle. For Maven installation, please refer maven.apache.org. For Gradle installation, please refer gradle.org .
Support
Reuse Trending Solutions
Find, review, and download reusable Libraries, Code Snippets, Cloud APIs from over 650 million Knowledge Items
Find more librariesStay Updated
Subscribe to our newsletter for trending solutions and developer bootcamps
Share this Page